Water scarcity futures tool
Calculation of future water stress and food production based on a publication by Kummu and others 2018
Code summary
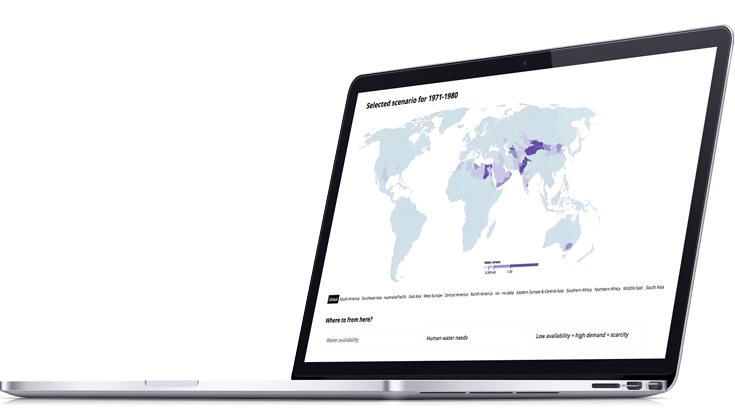
The Water scarcity futures tool shows scenarios of possible future water stress and food production. The analysis is based on a journal publication by Kummu and others in 2017, applied to Food Production Units instead of countries, and extended to use water availability and irrigation data from the ISIMIP project and domestic and industrial water use scenarios from the Water Futures and Solutions project (WFaS).
Water availability and irrigation use data is obtained on a 30 arcmin grid from ISIMIP-FT. We use three water models (H08, PCR-GlobWB, WaterGAP2) and two climate models (GFDL-ESM2M and HadGEM2-ES). The “pressoc” scenario is used, meaning that runoff and irrigation reflect the effect of current land and water infrastructure. The average across all water models and climate models is also calculated.
Irrigation water use is then modified based on actions to improve water use efficiency or productivity, as described in the publication by Kummu and others in 2018. Based on previous literature, the actions in each FPU are assigned productivity multipliers, for “medium” and “high” level of implementation, which result in increased food supply with the same water resources. These multiplier take into account current volumes of imports/exports. Yield gap closure, reduction of production losses and agricultural expansion apply to production. Diet change and reduction in distribution and consumer food losses apply to consumption.
New.food.supply = m.diet.change*m.food.loss.reduction.cons*(m.yield.gap*m.food.loss.reduction.prod*m.agri.expansion*local.prod-net.exports)
If instead, the improvements are used to reduce water use, with the same food supply, irrigation water use is reduced by the same ratio (and agricultural expansion increases water use). This assumes production and water are linearly related. This is obviously a significant simplification, but provides a useful first approximation before more sophisticated results are obtained.
Water stress is calculated according to the equation:
Stress = consumption / availability
As a third case, productivity improvements are first used to meet food demand, and any remainder reduces water use. This uses an average dietary energy requirement (ADER) of 2355 kcal/person/day.
Water availability, water use and food production is aggregated spatially to Food Production Units (FPU). This accounts for infrastructure, movement of users, and uncertainty in location of water resources and food production. Data is also aggregated to a decadal time scale to account for storage and uncertainty in timing.
Aggregation involved converting from kg m-2 s-1 to m3 by multiplying by cell area, continental land fraction, and the number of seconds in the calendar month, and using a gridded version of FPUs. FPUs were also assigned to world regions, for which populations under scarcity are calculated. The selected world regions are primarily designed to provide a zoomed in view of FPUs rather than as units of analysis. Within large basins, FPUs are either restricted to local runoff, or available water is aggregated and reallocated to FPUs based on their relative contribution to discharge in a study by Kummu in 2016 (see fractions allocated to each FPU).
Population data is from HYDE.
For their roles in producing, coordinating, and making available the ISIMIP model output, we acknowledge the modeling groups that provided data for this study and the ISIMIP coordination team.
See the analysis live!
The results from the code described here is featured in the atlas - you can explore possible futures yourself
Further reading
- Futures tool
- Publication by Kummu and others in 2017, on which this analysis is based
- Water stress
- Water shortage
Tags
Add your code too!
Have you done research related to water scarcity? Send us some information and we may publish your research in the Water Scarcity Atlas. Please email us at info@waterscarcityatlas.org
Feedback
Want to give us a feedback? Send us an email at info@waterscarcityatlas.org